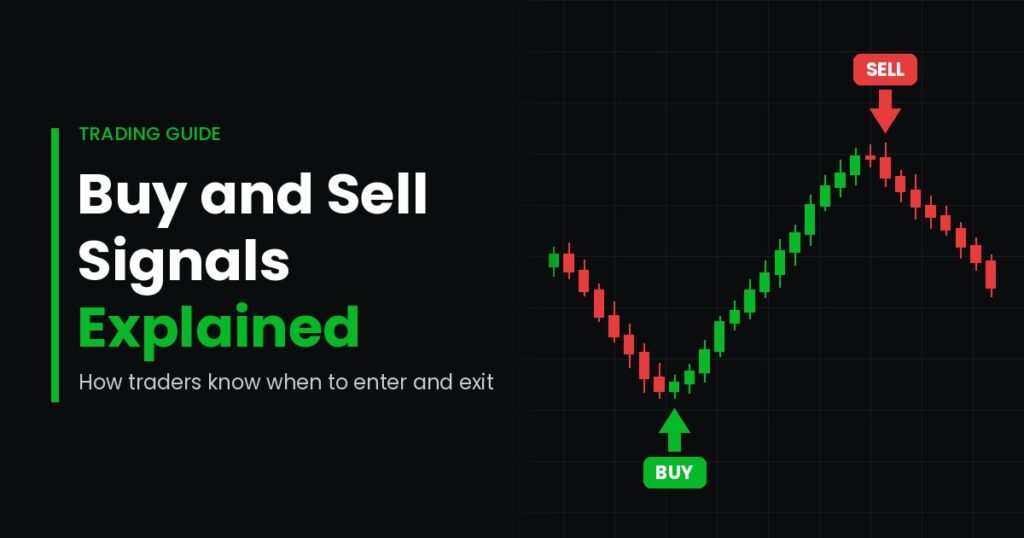
Every trade has two decisions at its heart: when to get in and when to get out. Most traders spend hours studying charts, yet many still struggle with timing. In fact, a good idea entered at the wrong moment can easily turn into a losing trade.
This is exactly where buy and sell signals come in. They give structure to decisions that would otherwise be driven by emotion. Instead of guessing, a trader follows clear conditions that point to a possible entry or exit.
Over two decades of watching markets, one pattern stands out. Traders who last are rarely the ones with the boldest predictions. Rather, they are the ones with a repeatable process for reading signals. In this guide, you will learn what these signals are, how they are created, and how experienced traders use them with discipline.
What Are Buy and Sell Signals?
Buy and sell signals are specific market conditions that suggest a good time to open or close a position. A buy signal hints that price may rise. On the other hand, a sell signal hints that price may fall, or that an existing long trade should be closed.
These signals are not magic. Instead, they are rules applied to price, volume, or time. For example, a trader may decide to buy when a short moving average crosses above a long one. That crossover becomes the signal.
It helps to think of signals as filters rather than forecasts. They do not tell you what will happen. However, they do tell you when conditions have historically favored one direction over another. As a result, the trader can act with a plan instead of a hunch.
Signals can also be grouped by purpose:
- Entry signals tell a trader when to open a position.
- Exit signals tell a trader when to take profit or cut a loss.
- Confirmation signals support or reject what another signal is saying.
How Buy and Sell Signals Are Generated
Most signals come from three sources: price action, technical indicators, and volume. Each one tells a different part of the story. Therefore, skilled traders rarely rely on just one.
Price Action
Price action is the raw movement of a market on the chart. Traders watch for breakouts above resistance, bounces off support, and candlestick patterns. A strong bullish candle closing above a key level is often read as a buy signal. Similarly, a failed breakout followed by a sharp drop can be treated as a sell signal.
Technical Indicators
Indicators are mathematical formulas applied to price or volume. They smooth out noise and highlight momentum, trend, or extremes. Because they are calculated from past data, most indicators lag price slightly. Even so, they bring objectivity to chart reading.
Volume
Volume shows how much conviction sits behind a move. A breakout on heavy volume is generally more reliable than one on thin trading. In contrast, a rally on falling volume may warn that buyers are running out of steam.
Common Buy and Sell Signal Indicators
There are hundreds of tools available. Still, a handful of buy and sell signal indicators have stood the test of time. Here are the ones most traders learn first.
Moving Average Crossovers
A moving average shows the average price over a set number of periods. When a faster average crosses above a slower one, a buy signal is produced. Conversely, a cross below suggests selling. The well-known “golden cross” and “death cross” use the 50-day and 200-day averages.
Relative Strength Index (RSI)
RSI measures the speed of recent price changes on a scale from 0 to 100. Readings above 70 are usually considered overbought. Meanwhile, readings below 30 are seen as oversold. Many traders wait for RSI to move back out of these zones before acting.
MACD
The Moving Average Convergence Divergence tracks the gap between two moving averages. A buy signal appears when the MACD line crosses above its signal line. A cross below is read as bearish. In addition, divergence between MACD and price can warn of a coming reversal.
Bollinger Bands
Bollinger Bands place a band above and below a moving average based on volatility. Price touching the lower band may signal a bounce in a range. However, in a strong trend, price can “walk the band” for a long time. So context matters a great deal.
Support and Resistance
These are price levels where buying or selling has repeatedly stepped in. A clean break and hold above resistance is a classic buy signal. Likewise, a break below support is a classic sell signal.
How Traders Know When to Enter
A single buy signal is rarely enough on its own. Experienced traders look for confluence, which means several signals pointing the same way. For instance, price may bounce off support while RSI climbs out of oversold territory. When volume also rises, the entry becomes far more convincing.
The trend is usually checked first. Most professionals prefer to buy in an uptrend and sell in a downtrend. A higher timeframe, such as the daily chart, is often used to set direction. After that, a lower timeframe is used to fine-tune the entry.
Patience is another key part of a good entry. Many traders wait for the candle to close before acting on a signal. This simple habit filters out a lot of false moves. Otherwise, a sharp spike inside a candle can trigger an entry that quickly reverses.
Finally, an entry is never taken without a plan for the exit. Before clicking buy, a disciplined trader already knows where the stop-loss and target will sit.
How Traders Know When to Exit
Exits are where most of the money is actually made or lost. Yet they receive far less attention than entries. In my experience, improving exits often lifts results more than finding better entries.
There are two kinds of exits. The first is a profit-taking exit, and the second is a protective exit. Both should be decided in advance.
Taking Profit
Profit targets are commonly placed at the next resistance level. Some traders use a fixed reward-to-risk ratio, such as 2:1. Others scale out, closing part of the trade at the first target and letting the rest run.
Sell signals from indicators also help here. For example, a bearish MACD crossover or RSI moving above 70 may prompt a trader to lock in gains.
Cutting Losses
A stop-loss is placed where the trade idea is proven wrong. This is usually just beyond a recent swing low or support level. If price reaches it, the position is closed without debate.
Trailing Stops
A trailing stop follows price as it moves in your favor. As a result, profits are protected while the trade is given room to grow. Moving averages or recent swing points are often used to guide the trail.
Trading Signals for Beginners: Practical Tips
Trading signals for beginners should be simple, clear, and easy to test. New traders often stack five or six indicators on one chart. Unfortunately, this usually leads to confusion rather than clarity.
Here are a few habits that make a real difference:
- Start with two tools. Pair one trend tool, like a moving average, with one momentum tool, like RSI.
- Learn one market first. Each asset has its own rhythm, so focus before you expand.
- Backtest before risking money. Scroll back on the chart and see how a signal performed in the past.
- Paper trade for a while. Practice on a demo account until your rules feel natural.
- Keep a trading journal. Write down why you entered, why you exited, and what you learned.
Mistakes to Avoid
One common mistake is chasing every signal. Not every crossover deserves a trade. Another is ignoring the bigger trend, which turns a good signal into a bad trade.
In addition, many beginners move their stop-loss further away when price goes against them. This feels safe in the moment. However, it often turns a small loss into a large one. Finally, avoid trading during major news releases until you understand how volatile they can be.
Why Risk Management Matters More Than Any Signal
No signal is right every time. Even a strong strategy may win only half its trades. So what separates profitable traders from the rest? The answer is how losses are managed.
Most professionals risk only 1 to 2 percent of their account on a single trade. That way, a string of losses does not wipe them out. Position size is then calculated from the distance between entry and stop-loss.
It is also wise to remember that markets change. A signal that works well in a trending market may fail in a sideways one. Because of this, rules should be reviewed regularly and adjusted when evidence demands it.
Above all, emotions must be kept in check. Fear can make you exit too early, while greed can keep you in too long. Clear buy and sell signals help, but only when they are followed with discipline.
Final Thoughts
Buy and sell signals give traders a structured way to decide when to enter and exit. They are built from price action, indicators, and volume, and they work best when combined. Moreover, they become truly useful only when paired with sound risk management and patience.
If you are just starting out, keep things simple. Learn a few tools well, test them honestly, and track your results. Over time, your confidence will grow from evidence rather than hope.
Many traders also explore signal tools to speed up their chart analysis. GainzAlgo is one such tool, offering indicators that display buy and sell signals directly on the chart. If you are wondering “is GainzAlgo legit,” the best approach is the same one you would use for any tool: read independent reviews, test it on a demo account, and judge it by your own results. In the end, no tool replaces a clear plan and steady discipline.